Indie game storeFree gamesFun gamesHorror games
Game developmentAssetsComics
SalesBundles
Jobs
TagsGame Engines

Levien

2
Posts
1
Following
A member registered Aug 02, 2024 · View creator page →

Recent community posts

(2 edits)

Hi!

Just thought I pitch in here, as a Cubase Pro user with access to supervision. However the MiniMeters is indeed is a great alternative for that at this price point. I use supervision mainly doing my actual masters. And use MiniMeters more as an Eye Candy tool, when casually listening to music. I find it such an awesome tool, which such a great, fast, and near (if nor zero) latency response, even whilst running an old GT 710 GPU.

See my post below your actual post, where I ask for the exact same suggestion of a correlation meter. 

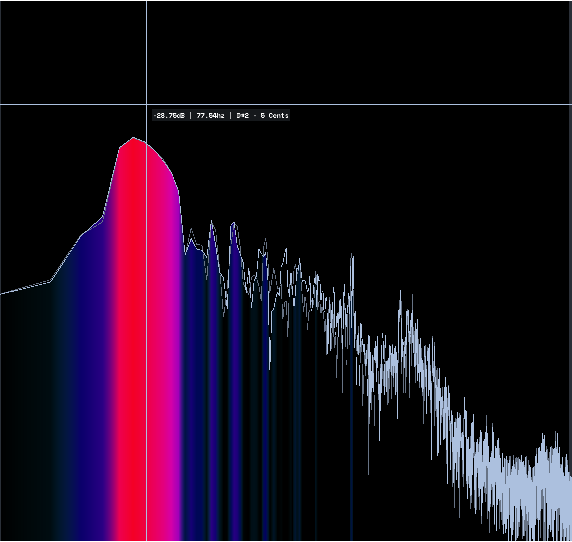
As for the spectrum analyser it is literly possible to do just what you ask for, instead of hovering of the analyser, click on the frequency response curve / section that you want to readout with your left mouse button, it will show the frequency and note. I attached an image as an example. 

Also two examples of a correlation meter suggestion I suggested as well also listed in my post below yours :P.

Below the spectrum: frequency & note readout when clicking your mouse button the section you want to read out.
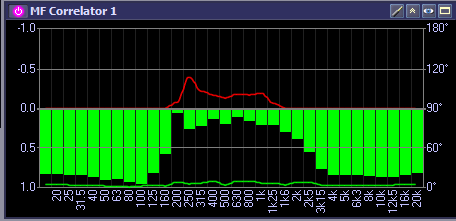
And here's my two suggestion for a correlation meter, 1 is metering the entire track, the second one is a per frequency band correlation meter.

Take care! Hope this helped a bit :)!

(4 edits)

Hi!

I recently bought the MiniMeters software for Windows 10! And I am very happy with it! Money well spend, and I use it almost every day whenever listening to music, or checking my masters.

It works so fast, and the response is awesome!

However I have 5 points of attention. Which might be possible to improve the program even more.

1: Each time I open the MiniMeters, it does not remember the StereoMeter sizing. I have the Spectrogram running on my 1st monitor in full screen, and the rest on my 2nd Monitor. Whenever I re-open the MiniMeters, it loads the Spectrogram nicely on the 1st monitor in full screen and the rest on the 2nd Monitor. But each time the StereoMeter is resized to the smallest windowing. It would be cool if remembers the panels window sizes.

2: It would be cool, and a nice feature to be able to stack the panels below each other as well, now you can only scale in horizontal mode. But being able to for example have the spectrogram encompass an entire botton section below the rest of the panels, so you have a nice long spectrogram overview, and the rest is nicely squared above it.

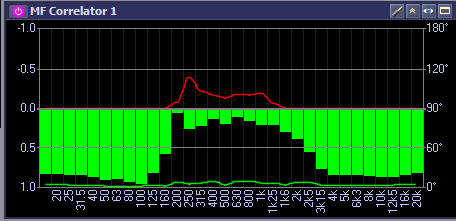
3. Is there a plan to add / incorporate a correlation meter? Like a meter that shows when stuff is getting out of phase. I attached an image to show you an example, would be even cooler if it could do this per frequency band. But that might be a little hard to code.

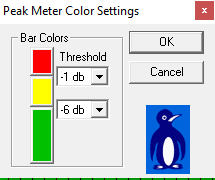
4: The Levels meter uses a certain amount real estate, which is much wider than it actually panel / module needs to be, however you can't make it smaller but it's such a small module, that it would be cool to able to make smaller, so you have a bit more real estate for the rest of the panels / modules. Also it would be cool to be able to set color amounts, for different DB values. Also attached an image as an example.

5. Would be cool to have an enable, disable / toggle, always on top feature.

Last but not least I know this might be a bit much to ask. And I don't know if it's even possible compatibility wise. But to make an Elgato Streamdeck plugin/profile for this, where for example you can map each Module / Panel to an individual button. Or perhaps even make it so that you can have different profiles that will actually span a certain module across all buttons of the Streamdeck. I know there's the Streamdeck Mini with 6 Button, the Regular one with 15 Button and the XL with 32 Buttons (This is the one I own). Very happy with that, but I am still missing any sort of good audio visualizer on this device.

Thanks for the great software, really happy I bought it, and happy to support to the development this way!

Keep up the great work!

Kind regards,
Levien

Below: Correlation meter example:


Below an example of setting for coloring that could be applied to the level meter:

Below an example of what correlation with analytics per frequency band could look like: